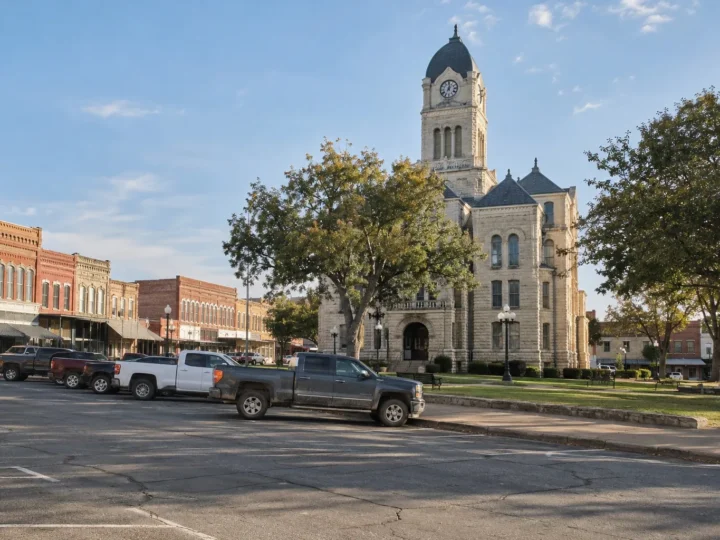
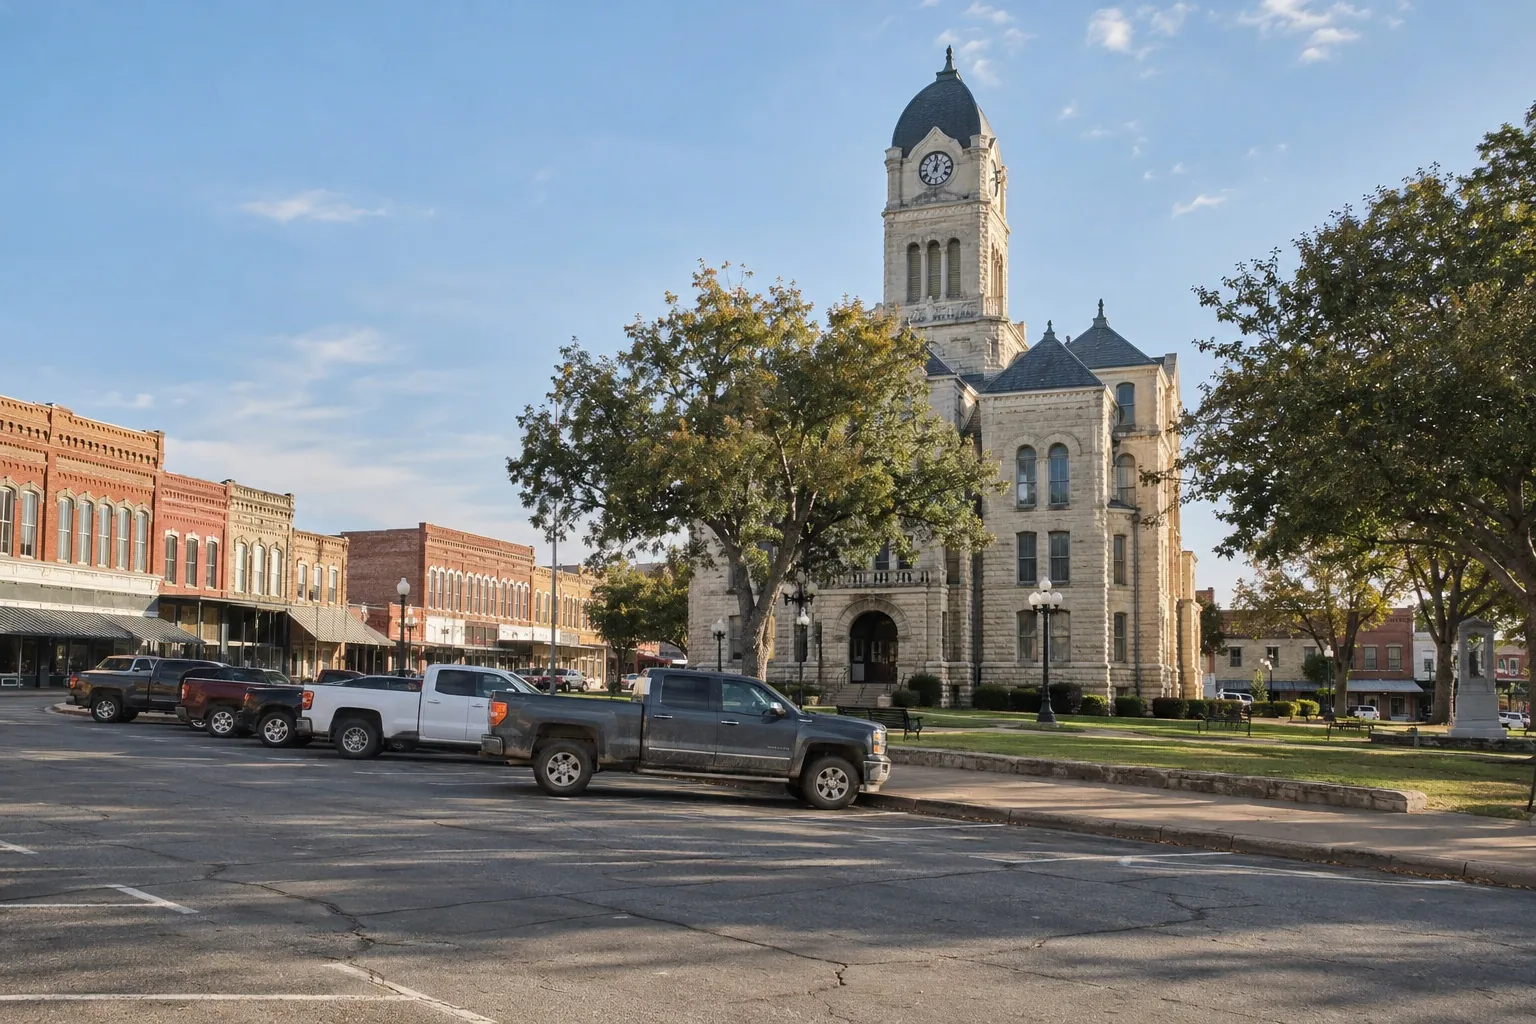
Monthly market update for homes in Bonham, Texas: homes for sale, under contract and sold, median prices and days on market. Prepared by Ten Twenty Realty.
(Data through 31 October, 2026)
NOTE: Data is based on listings shown on this site.
31
New Listings
+82.4%Prior month
12
Sold
+9.1%Prior month
123
Avg Days on Market
+17.1%Prior month
$225,950
Median Sold Price
-9.6%Prior month
—
Sold Vs. List
Not enough data
104
Active Listings
+3%Prior month
| Current | Prior 1 Month | Prior 3 Months | Prior 6 Months | |
|---|---|---|---|---|
| New Listings | 31 | 17 | 21 | 19 |
| Sold | 12 | 11 | 7 | 10 |
| Median Price | $214,950 | $195,000 | $224,500 | $373,950 |
| Median Sold | $225,950 | $250,000 | $174,900 | $202,000 |