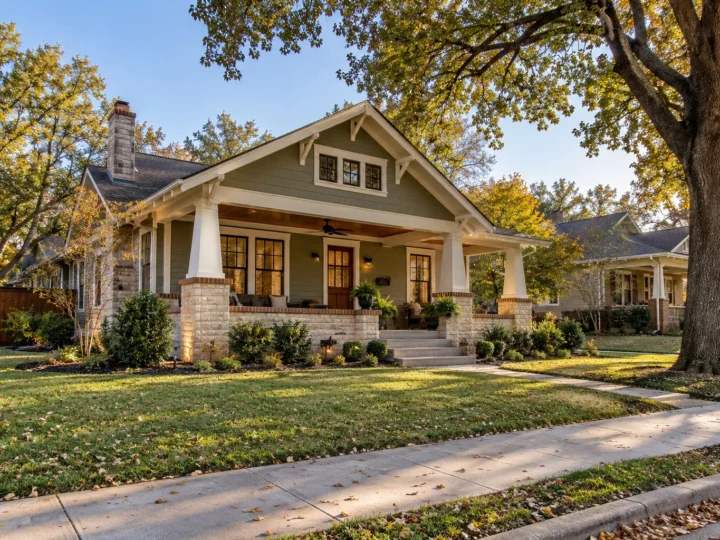
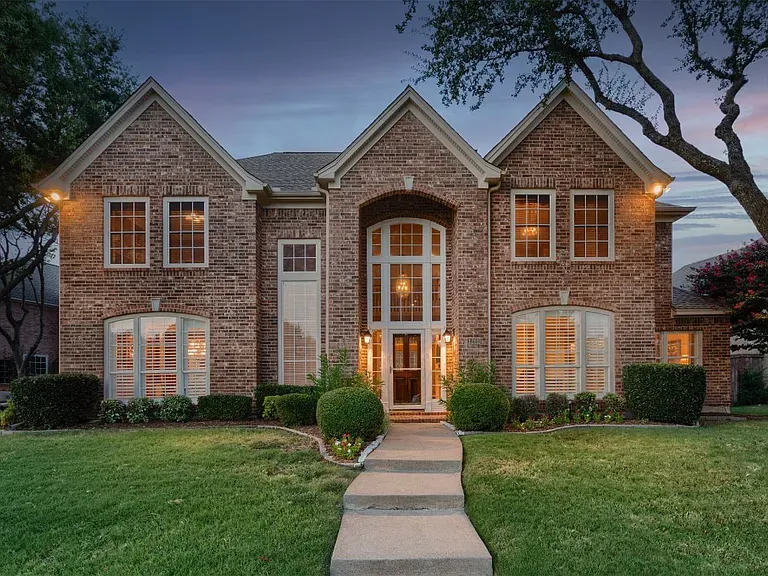
Two-story brick home in a North Texas neighborhood — market report for local home prices

Market data

North Texas market reports.

Our North Texas market report shows live numbers from the MLS — what’s for sale, what’s selling and for how much, town by town.

Homes for sale now

Compare the market across our core towns.

How many homes are for sale in each town, how long they’ve been listed, and the price range — houses, townhomes and condos. Click a town to see its homes.

City Active Listings Days On Site Average Price Price / Sqft High Price Low Price
Aledo 205 91 $1,169,581 N/A $14,250,000 $240,000
Allen 324 85 $638,071 N/A $10,599,000 $161,000
Anna 458 99 $471,165 N/A $6,300,000 $189,000
Aubrey 485 96 $534,975 N/A $12,000,000 $139,000
Azle 212 90 $515,549 N/A $2,300,000 $88,000
Bonham 119 139 $332,179 N/A $1,525,000 $35,000
Caddo Mills 131 105 $449,412 N/A $4,100,000 $99,500
Celina 1149 104 $643,202 N/A $7,695,000 $225,000
Denison 315 110 $380,194 N/A $9,900,000 $27,900
Denton 768 88 $508,545 N/A $16,500,000 $89,000
Flower Mound 278 87 $1,145,434 N/A $10,000,000 $250,000
Forney 814 104 $378,431 N/A $2,999,999 $155,000
Fort Worth 3968 81 $454,887 N/A $13,900,000 $51,200
Frisco 972 83 $909,265 N/A $15,000,000 $195,000
Grapevine 106 81 $801,869 N/A $2,049,000 $349,000
Greenville 327 98 $329,237 N/A $3,850,000 $59,900
Gunter 85 126 $851,683 N/A $5,000,000 $165,000
Keller 144 72 $1,097,724 N/A $6,900,000 $309,000
Leonard 54 115 $681,668 N/A $2,999,000 $70,000
Lewisville 291 74 $526,137 N/A $3,850,000 $105,999
McKinney 1126 78 $615,381 N/A $14,650,000 $189,999
Melissa 174 104 $581,506 N/A $8,232,750 $159,900
Midlothian 439 113 $605,644 N/A $4,970,000 $100,000
Pilot Point 200 104 $851,741 N/A $15,747,100 $115,000
Plano 737 73 $689,247 N/A $21,500,000 $156,900
Princeton 707 72 $353,542 N/A $2,500,000 $79,900
Prosper 427 101 $985,709 N/A $5,750,000 $189,500
Richardson 334 73 $558,604 N/A $2,499,000 $119,000
Rockwall 439 95 $609,439 N/A $3,000,000 $155,000
Royse City 546 108 $422,785 N/A $4,500,000 $56,800
Sachse 107 88 $458,918 N/A $829,999 $230,000
Sherman 453 99 $360,042 N/A $2,500,000 $52,999
Springtown 259 98 $487,560 N/A $3,757,000 $105,000
The Colony 164 78 $615,615 N/A $2,295,000 $139,000
Trenton 50 123 $395,491 N/A $768,000 $89,999
Van Alstyne 291 107 $616,537 N/A $11,000,000 $115,000
Waxahachie 489 98 $532,825 N/A $3,800,000 $1,000
Weatherford 648 99 $670,533 N/A $8,150,000 $1
Wylie 315 84 $514,096 N/A $1,450,000 $199,000

Monthly reports

Open the monthly market report for any town.

New listings, homes sold, days on market and median prices for the month — with six-month trends and charts — for each town we serve.

Aledo market report

Parker County

Allen market report

Collin County

Anna market report

Collin County

Aubrey market report

Denton County

Azle market report

Tarrant & Parker Counties
Bonham market report

Fannin County
Caddo Mills market report

Hunt County

Celina market report

Collin & Denton Counties

Denison market report

Grayson County

Denton market report

Denton County
Flower Mound market report

Denton County

Forney market report

Kaufman County

Fort Worth market report

Tarrant County

Frisco market report

Collin & Denton Counties

Grapevine market report

Tarrant County

Greenville market report

Hunt County
Gunter market report

Grayson County
Keller market report

Tarrant County

Leonard market report

Fannin County

Lewisville market report

Denton County

McKinney market report

Collin County

Melissa market report

Collin County
Midlothian market report

Ellis County

Pilot Point market report

Denton County
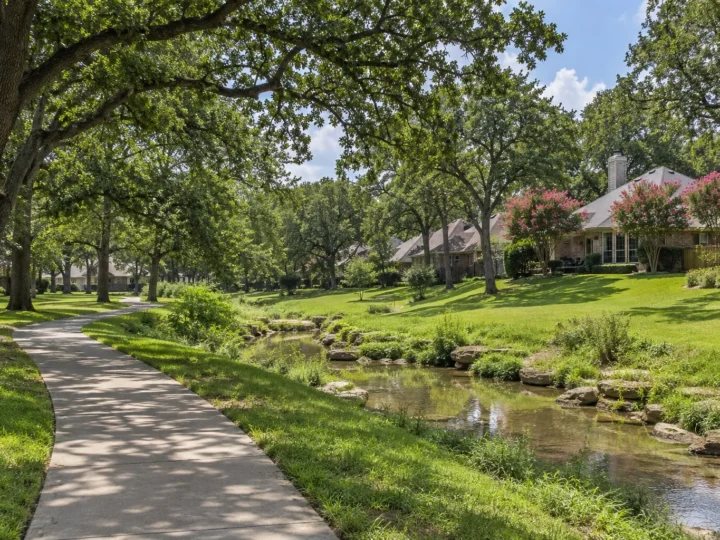
Plano market report

Collin County

Princeton market report

Collin County

Prosper market report

Collin & Denton Counties
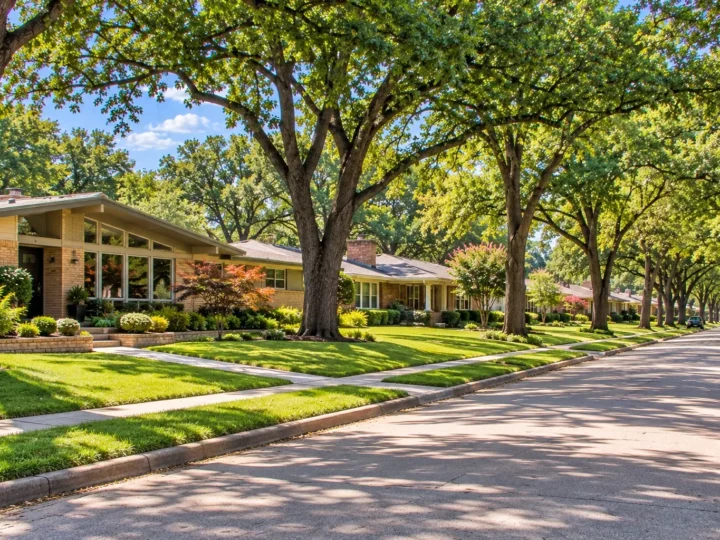
Richardson market report

Dallas & Collin Counties

Rockwall market report

Rockwall County

Royse City market report

Rockwall County
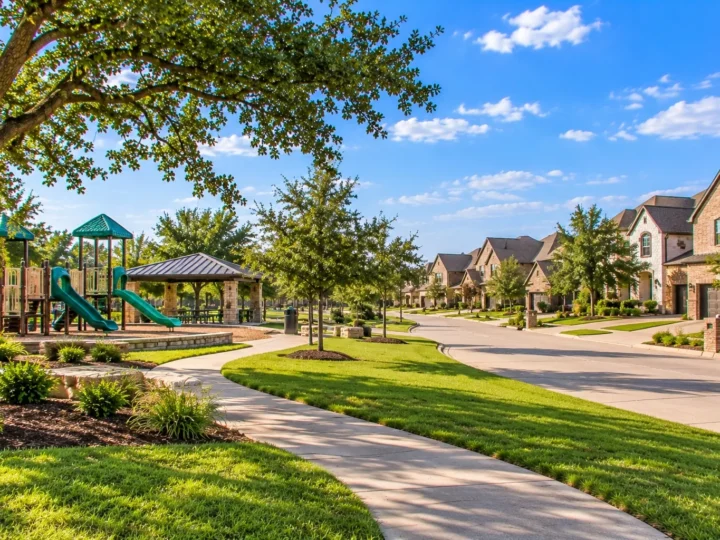
Sachse market report

Dallas & Collin Counties
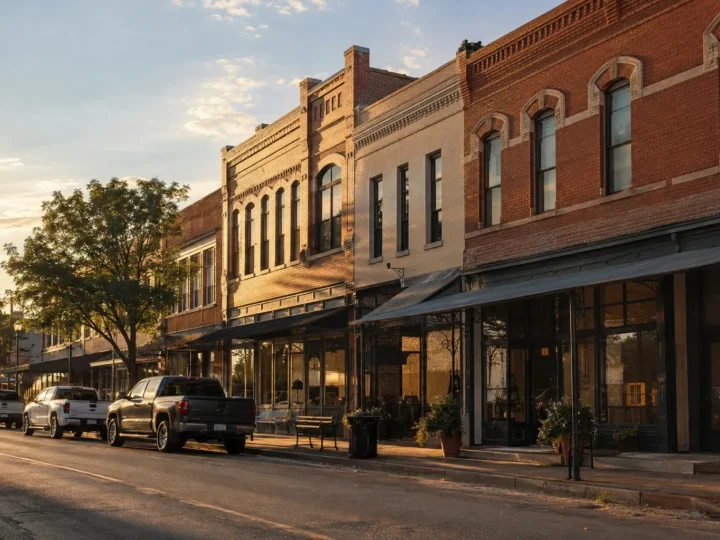
Sherman market report

Grayson County
Springtown market report

Parker County

The Colony market report

Denton County

Trenton market report

Fannin County

Van Alstyne market report

Grayson County

Waxahachie market report

Ellis County
Weatherford market report

Parker County

Wylie market report

Collin County

What’s my home worth?

A local agent’s price for your home

Reading the numbers

How to read a market report

Where does the market report data come from?

Directly from the NTREIS MLS through our IDX feed (Buying Buddy), updated automatically. The figures cover houses, townhomes and condos; land, lots and commercial property are left out so they don’t skew prices.

What does “days on site” mean?

The average number of days the homes for sale now have been listed. Higher numbers usually mean buyers have more choice and more room to negotiate; lower numbers mean homes are selling faster.

Why do median prices change month to month?

Medians move with the mix of homes that sold — a few large sales can shift them. Look at trends over several months; the Texas Real Estate Research Center publishes long-term data for Texas metros.

How often is the market report updated?

Every day, with the MLS feed. Sold figures (median sold price and homes sold) cover the last 60 days.

Can you explain the market report for my neighborhood?

Yes — request a free home value and we’ll explain what the numbers mean for your street.

Rooted in service

Numbers are only half the story.

A local agent can tell you what the market means for your street, your acreage and your timeline — with a complimentary Comparative Market Analysis.